Home
QGIS 3
Digitizing Features from a Georeferenced Map
We can now trace historical / spatial data from our georeferenced historical map to create new shapefiles recording a variety of information (historical streets, plazas, coastlines, buildings, etc.)
When working with large numbers of georeferenced maps or simply a very complex map, there are automated methods for extracting elements from a georeferenced raster. In this case, however, we will just trace features directly from our georeferenced map.
Key Resources
If you need additional information and tutorials see:
- Creating New Vector Layers in QGIS 2.0 from the Programming Historian.
I. Create a new shapefile of points
To create a new shapefile layer:
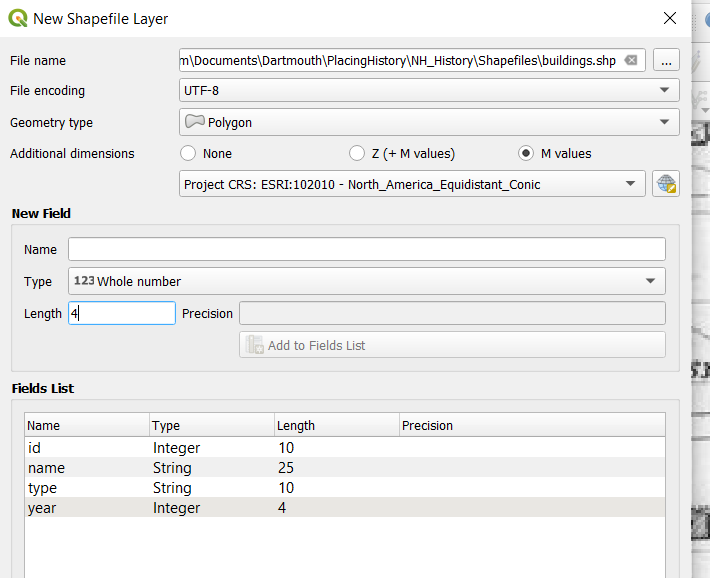
- Layer → Create Layer → New Shapefile Layer
- Select "..." and navigate to the folder you will save your shapefile in.
- Give the shapefile a name (like "burnt_buildings") and select Save.
- select "UTF-8" for the file encoding
- set the geometry type as "point"
- Set the Project CRS as North American Equidistant Conic
- Create a new field called "name" to record the name of the chosen building (also choose "text" and length of "20").
- Select Add to fields list and then select OK.
- Also create a new field called "burnDate" to record the date the building burned down.
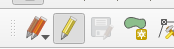
- To create your points, right-click on your new "burnt_buildings" layer and select Toggle Editing. In the layers window, there should now be a pencil next to the burnt_buildings label.
- Now select the Add Point Feature
- Begin tracing the desired feature.
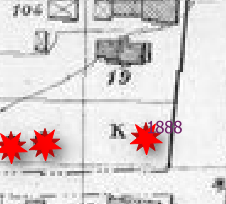
- Click on locations of burned buildings.
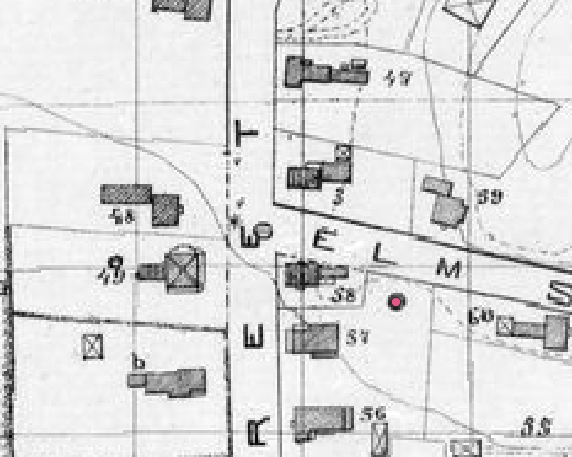
- Add building name and date information where this information is noted on the map (for example, the building labeled "K").
II. Choose a symbol to represent each burned building and label the date in which it was burned down.
- Open the properties window for your burnt buildings shapefile.
- Change the symbol
- Select the Symbology tab in the Properties window.
- In the drop-down menu choose "All Symbols."
- Choose the symbol you want to represent all burnt buildings.
- Label the Date
- Select the Labels tab in the Properties windows
- Change "no symbols" to "single symbol"
- Select "burnDate" (or whatever your variable name is) for Value.
- Select a Font, Font Size, and Font Color of your choosing
- Press OK
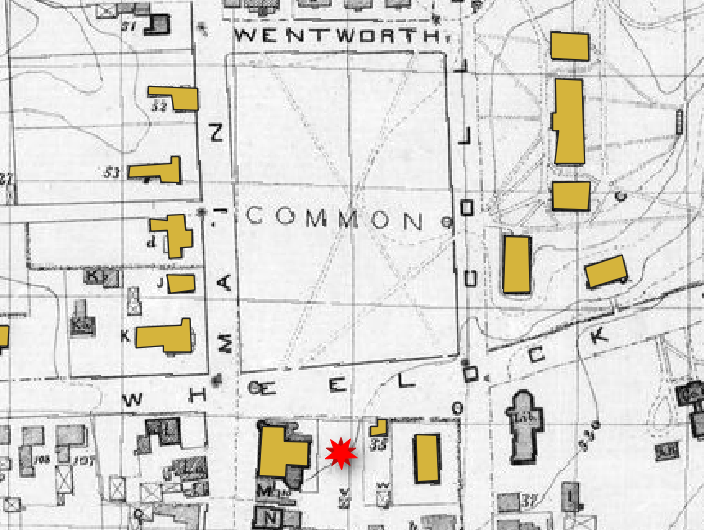
- The result may look something like this.
- In this case the label overlaps the symbol. To fix this, open the Properties for the shapefile, select the Placement tab and increase the Distance for the label.
III. Create a new shapefile of polygons (for buildings)
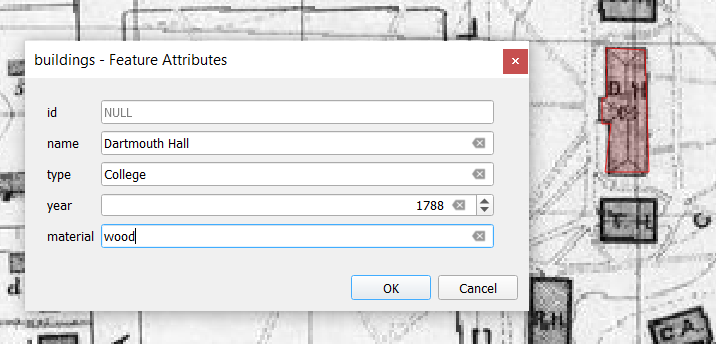
- Follow the directions in Step I, but this time create a new polygon shapefile named "Buildings." Create attribute fields to record the a) building name, b) building type, and c) year it was constructed.
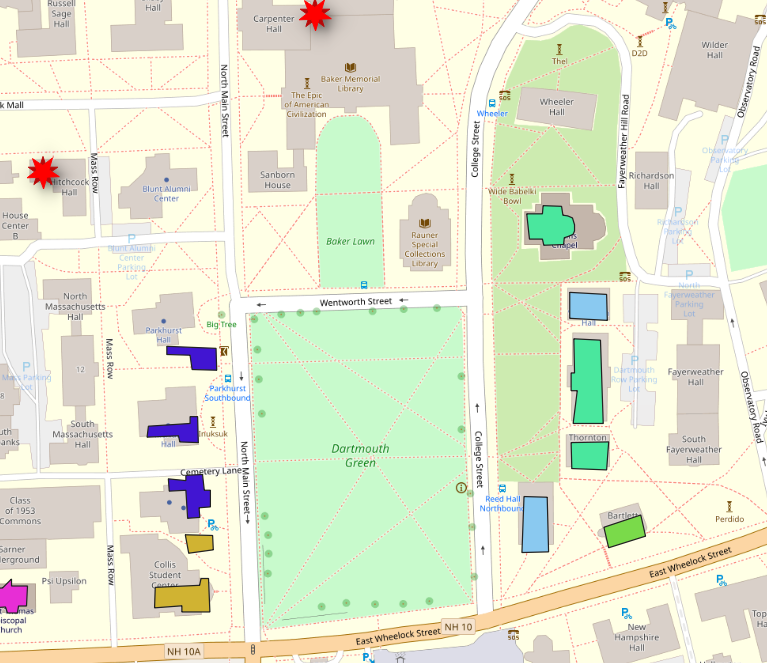
- Begin tracing buildings from your map, starting with those around The Green. (Select the "Pencil" symbol to begin editing the shapefile and then the "Add Polygon Feature" symbol, the green polygon wih gold star below) to begin tracing each polygon. don't do them all, just choose a cluster of ten or so buildings to trace.
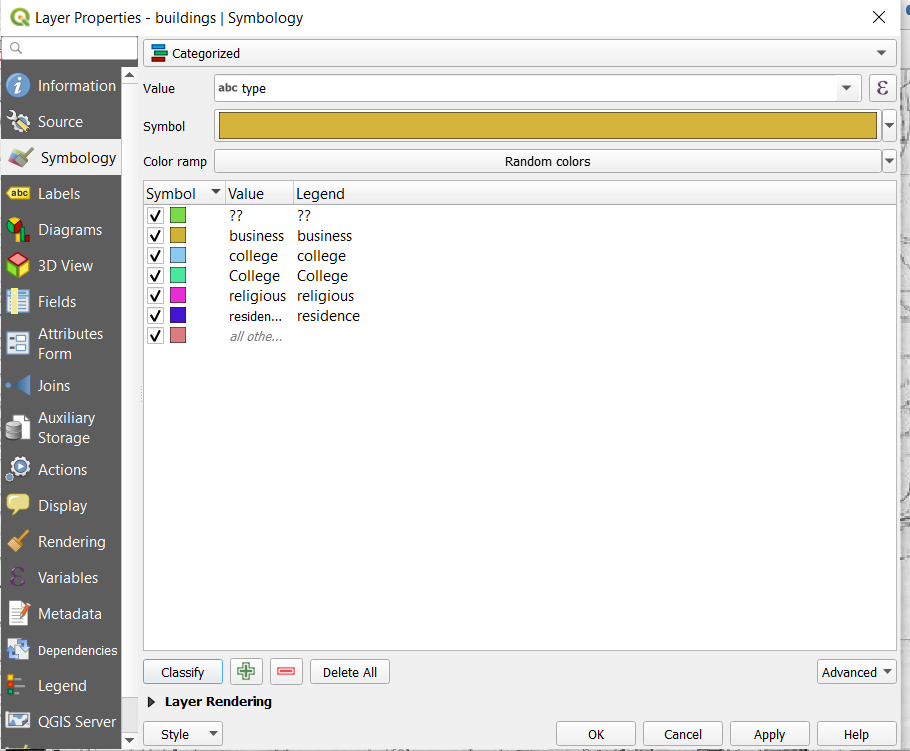
- Review the legend at the bottom of the map to record information for each building. Review the description of buildings in the legend to create your own classification system of building "types" to record as attributes for each building. My classification looked like this:
- After tracing some buildings, your map may look something like this:
IV. Modify the symbology of your buildings layer
- Open the Properties for the buildings shapefile.
- From the Symbology tab change the drop-down menu from "Single symbol" to "Categorized."
- For Value select the variable you want to use to symbolize the buildings
- Press Classify to show all the categories.
- Press OK
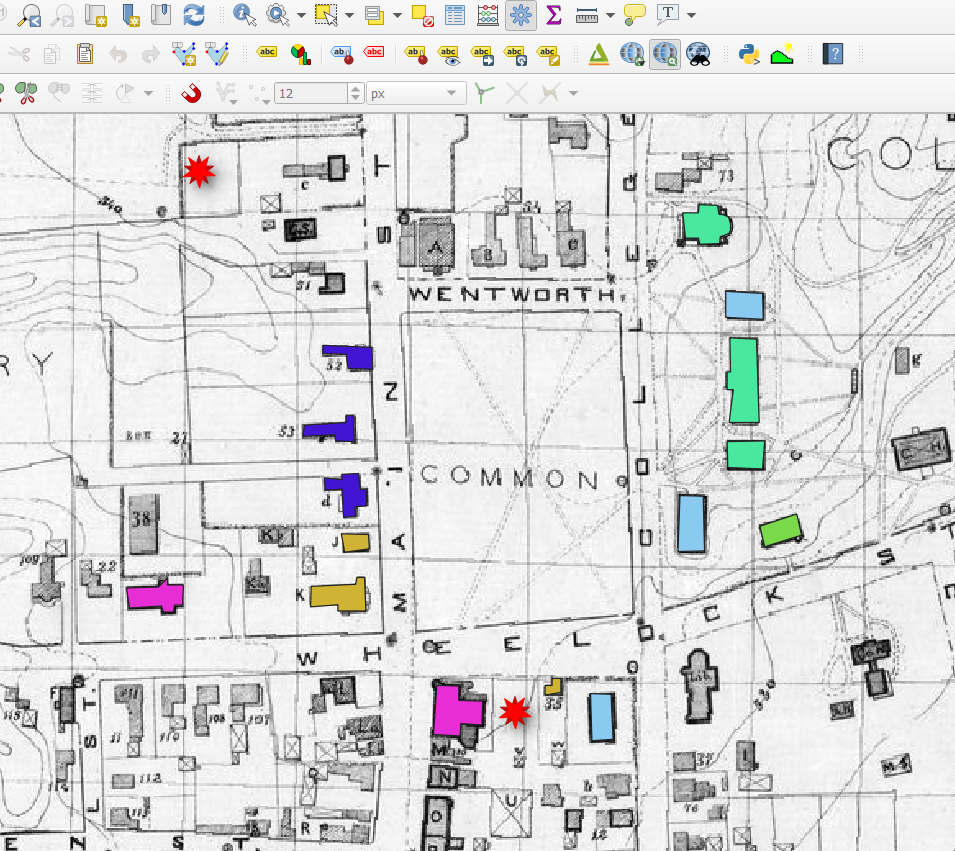
- Your map should now look something like this.
- Removing the georeferenced map and showing your shapefile over OSM Street Map can reveal how the buildings of Dartmouth's campus have changed since 1890.
V. Add scale-dependent labels to buildings
To show labels for the buildings only when zoomed in close:
- Open the Properties window for the shapefile
- From the Labels tab, select "Single Labels" and choose the building "name" from the "Value" menu.
- Still within the Labels tab, select Rendering from the menu in the middle and experiment with different scales for the "Minimum scale" drop-down menu so that the names of your buildings only appear when zoomed in fairly close.
VI. Create a street shapefile
Following a similar procedure as the burnt buildings (points) and buildings (polygons) layers above, create a line shapefile representing the streets of Hanover.
Just draw in the main streets around the Green (no need to do them all). Adjust the width of the roads to best match the historical map. Label the roads.
VII. Submit your map
- Choose an appropriate scale / zoom level to view your new map showing some (not all!) of Hanover's buildings from 1890 as well as some of those that burnt down.
- Choose what base map you want to show underneath your new shapefiles. You can choose to show a modern street map (i.e. OSM Street map) for comparison or keep your 1890 historical map as the base map.
- Experiment with the labels so they appear clearly. You may want to select your buildings Properties menu and adjust the "Placement of the labels so they appear offset from the buildings themselves.
- Export your map as pdf (Project → Import/Export → Export Map as PDF)
- Submit to "tutorials_submission" folder within the class shared folder.
Next Steps
- Creating a Map Legend and Print Layout QGIS Tutorial 3b.
- Mapping and Analyzing Spatial Data QGIS Tutorial 4.